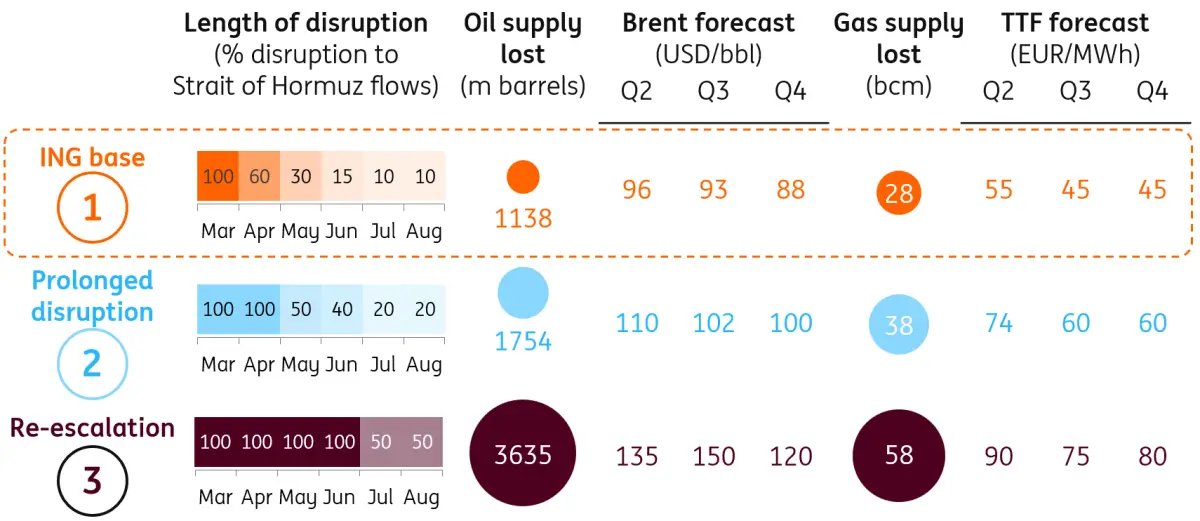
Implications of WTI Oil Futures In Backwardation Amid the Supply Crunch


Since war broke out between the U.S., Israel and Iran on February 28, the crude oil futures curve has moved into a steep backwardation, a situation that persists even after the announcement of a temporary ceasefire on April 7. Prices for WTI crude oil futures delivered in December 2026 have been as much as $40 below prices for delivery in May or June (Figure 1). This suggests that traders expect the current supply disruptions caused by the effective closure of the Strait of Hormuz will most likely prove to be short-lived, with spot prices perhaps falling to the mid-$70s by year end. But what does the historically extreme backwardation imply for investors?
A snapshot of the WTI curve taken on April 15, 2026
Contango happens when prices for contracts further out on the futures curve are higher than those for the spot and front-month prices. This usually occurs when markets are oversupplied. In this situation, those who can’t sell their oil immediately have to pay the “cost of carry,” which includes storage costs, insurance and interest expenses. A positively sloped futures curve (contango) leads to a negative roll yield.
By contrast, backwardation occurs when prices for near-term delivery exceed prices for delivery further out in the future. Backwardation typically happens in tight, undersupplied markets with either scarcity of supply or high demand. This creates a strong “convenience yield” when the value of having oil on hand exceeds storage, insurance and interest expenses, leading to a negatively sloped futures curve and a positive roll yield.
Since 1985, the crude oil market has been in contango around 42% of the time and in backwardation 58% as measured by the price difference between the front-month contract and contracts six months in the future, but contango and backwardation are usually overlooked by casual market observers.
Normally, when one looks at historical crude prices, one sees a time series of front- month contracts. While stringing together front-month prices is extremely useful for gauging where crude prices were historically, they don’t convey an accurate picture of what sort of return one could have achieved in the oil markets simply by holding a long (or short) position in the futures market and rolling the contracts forward at a set period (say 10 days) prior to contract expiry.
Imagine a case where an investor who had been long the April 2026 Micro WTI contract at the start of the war on February 28 and had rolled the contract on March 6 (10 days ahead of that contract’s expiry) into the May 2026 contract. Between the market close on Friday, February 27 and the afternoon of April 9, the spot price rose by 48% from $67.02 per barrel to around $99. However, the actual return on a long position (ignoring transaction costs) would have been greater owing to the backwardation of the curve. Between February 27 and March 6, the April contract rose from $67.02 to $90.90, a 35.6% gain. Meanwhile, on March 6, the May Micro WTI contract closed at $87.52. If one had closed out the April contract position and initiated a May contract position at the March 6 closing price, the May contract price would have risen from $87.52 to $99, a further 13.1% gain. If one compounds out the gains, (1+35.6%)(1+13.1%)-1, one finds a 53.4% gain, around 5.4% more than the simple variation in strung together front-month prices would have suggested. This 5.4% is the positive roll yield in March stemming from the backwardation in the crude oil curve.
Over time these seemingly modest differences between the variation in historical WTI front month prices, which ignore roll yields, and the actual return of rolled futures positions can be extremely large. For example, at the beginning of 1985, WTI’s spot price was $25.92 compared to around $100 at the time of this writing. On that basis, one might have imagined that holding crude oil and rolling the contracts forward for the past 20-plus years would have resulted in a gain of nearly 300%. However, rolling the contracts forward prior to expiry, thereby taking into account the accumulated cost of interest-rate carry, storage costs etc., would have resulted in a gain of closer to 191% since 1985
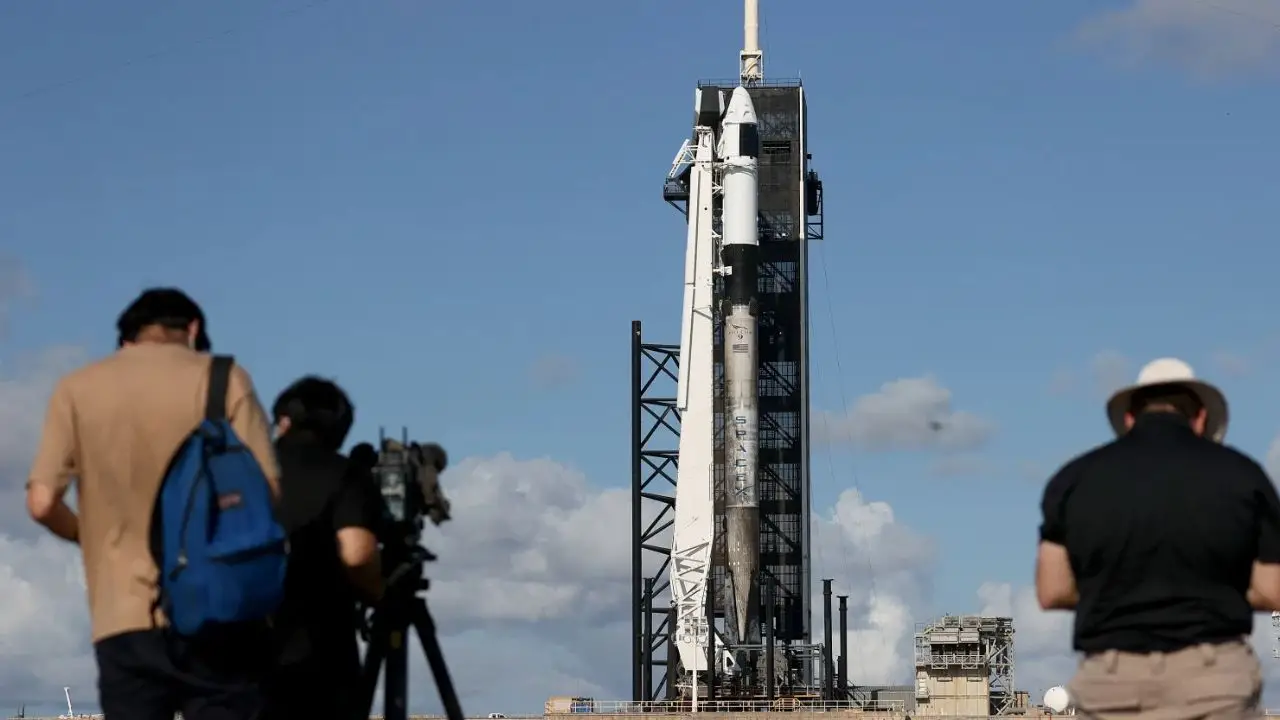
SpaceX said a portion of shares in its blockbuster public offering will be sold directly throu...
By- Shahzad Ahmad (Market Analyst | Investor | Trader | Strategist) May 23, 2026 at 1...
Global markets extended their rally as easing geopolitical tensions in the Middle East, falling o...
By- Shahzad Ahmad May 22, 2026 at 10:39 AM (GST) Investors in the safe haven of G7 de...
Risk sentiment remained firmly positive to start June, with US equity futures pointing to fresh record highs despite ...

Oil prices surged nearly 3% on Monday after renewed hostilities in the Gulf raised concerns over the reopening and se...

By- Shahzad Ahmad Market Analyst | Investor | Strategist Main Highlight Global stock markets climbed t...